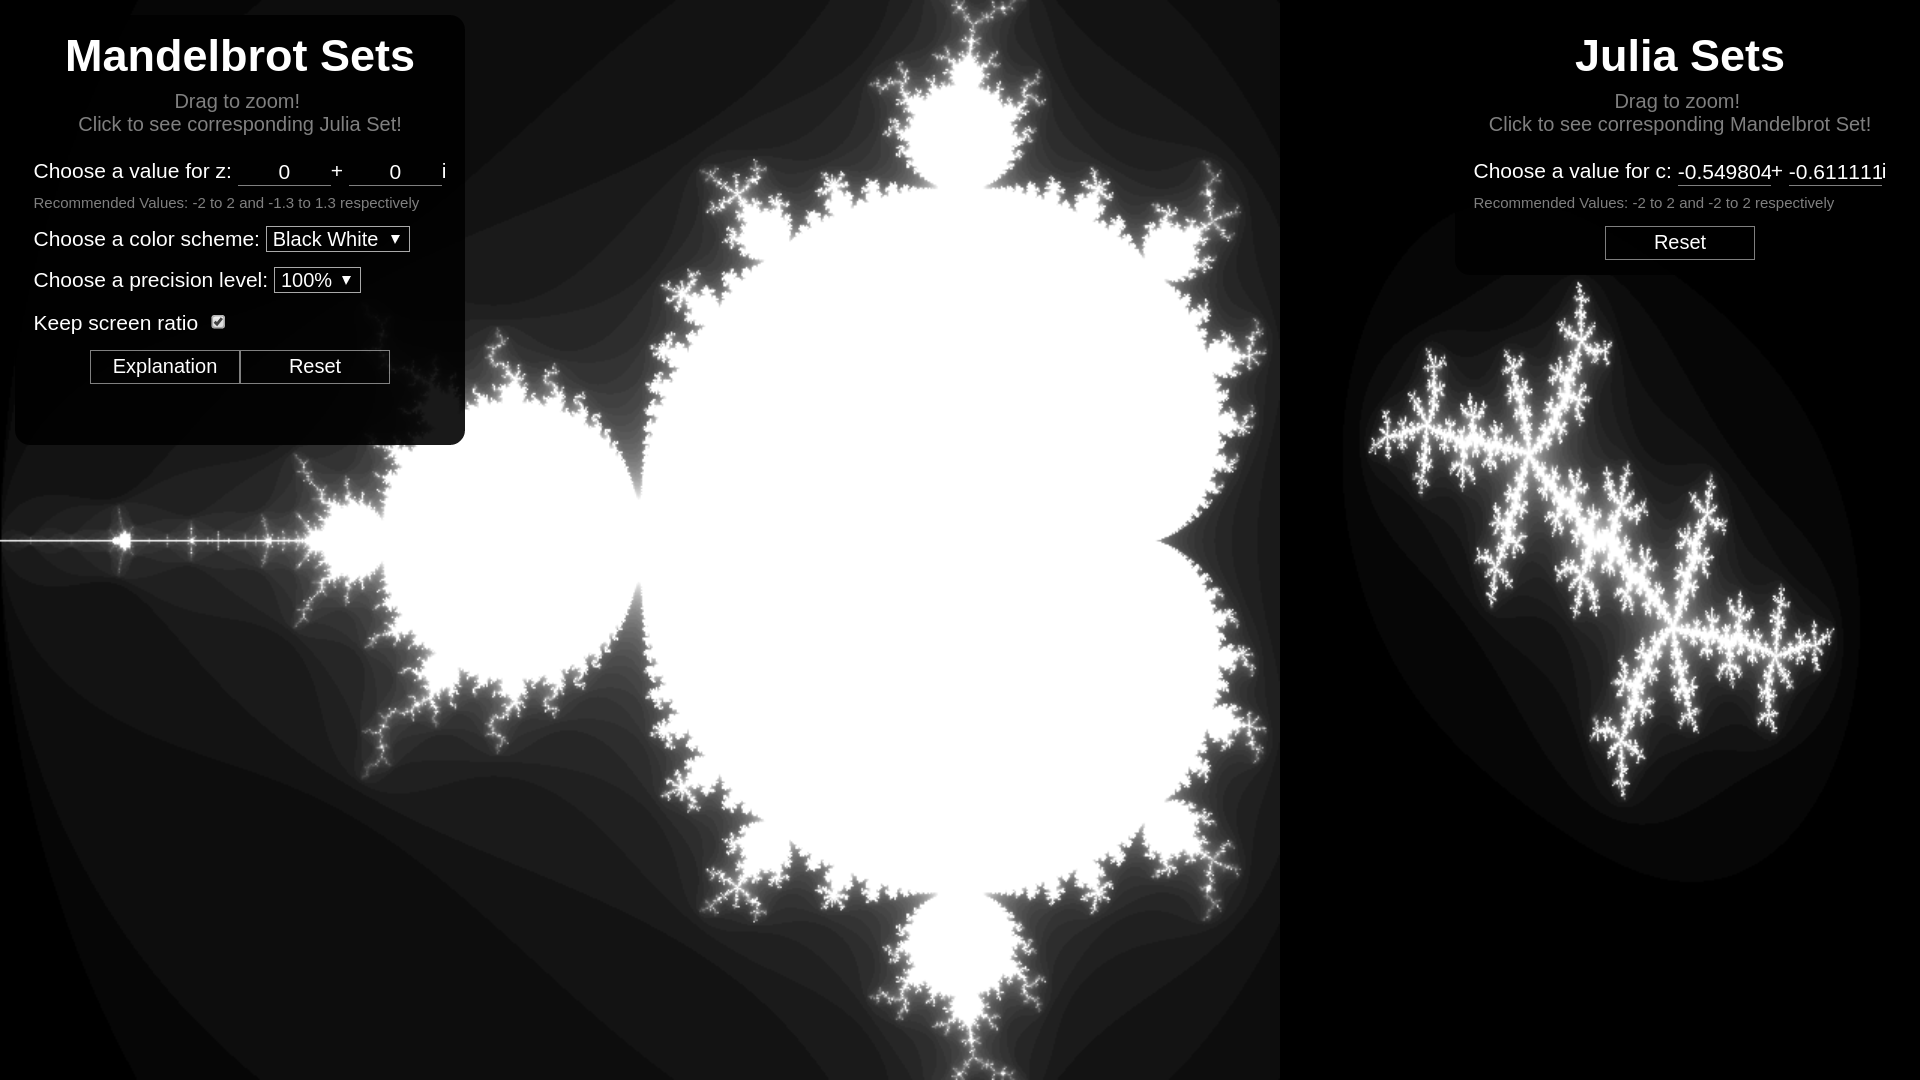
The core series being investigated is is zn+1 = zn2 + c where z and c are complex numbers. The graphs displayed lie on the complex plane of a+bi, which represents the values of z and c chosen for the series, respectively. The to construct the graph on the left, we pair the coordinates of the left graph (z0) with one fixed point from the graph from the right (c). The to construct the graph on the right, we pair the coordinates of the right graph (c) with one fixed point from the graph from the left (z0). We are interested in how fast the series zn diverges with chosen initial z0 and c, so we color the graph with white representing no divergence and black representing rapid divergence.
The graph being displayed on the left is the Mandelbrot set, where z0 is set to be 0 by default. Thus the Mandelbrot set is a 2D representation of a 3D fractal surface.
A related collection of sets displayed on the right are the Julia sets, of which is generated by instead testing the convergence of a fixed c, with
varying z values from the complex plane. Thus the Mandelbrot set is the intersection at the origin on the complex plane with
the Julia sets following the series
zn+1 = zn2 + c.
To truly appeciate the duality of these two sets, this tool is created to explore the various Mandelbrot and Julia sets for different initial z and c values, allowing, albeit gradual, exploration of the 5D fractal surface of the divergence of this beautiful series.
Click and drag to draw a rectangle that you wish to zoom into. Click on either graph to change the input for the other graph. Change settings in the settings box as desired. Look up Mandelbrot set and Julia sets!
Vanilla JavaScript with canvas, webpack to inject JavaScript into base HTML file.
####Graphs
The two graphs are rendered pixel by pixel using their coordinates on the a + bi axis as input into the recursive series. The divergence of the series is scored to determine pixel rgb values. The pixels are rendered by iterating over the x and y resolution and setting their rgb values via imageData in canvas.
####Zooming
On mouse drag, a rectangle is rendered displaying the area that will be zoomed once the mouse is let go. This is accomplished by saving the first vertex when the mouse click is held down and the second vertex when the mouse click is let go. The new x y ranges are calculated and then a re-render is called. Upon zooming many times, users will notice that the graphs become pixelated. This is due to the fact that, with default JavaScript, we have a limited number of decimal places we can conduct calculations over. Once we run out of decimal places we can no longer calculate at the required precision, and round off errors will occur. This leads to many neighborhoods of coordinates resulting in the same output.
####Clicking
If the distance between the two vertexes from zooming is too small, ie: 5 pixels, the action will instead set the z0 and c values respectively. This affects the opposite graph, thus calling a re-render on the other graph.
####Changing Colors
A few color schemes has been added to the application. These color schemes are callbacks given to the render function so different rgb values can be calculated from giving different functions. These functions need to be continuous and within 0-255, thus the color schemes were constructed mainly from using trigonometric functions.
####Changing Rendering Precision
Choosing different levels of precision tells the renderer to skip the calculation of n number of pixels. In this case, we skip none for 100%, every other pixel for 50% and 2 pixels for every calculated pixels for 33%.
###Future Direction
####Saving
Allow users to save pictures to desktop.
####Custom color schemes
Implement a REPL that will allow users to create their own color schemes.